Published: , Modified:
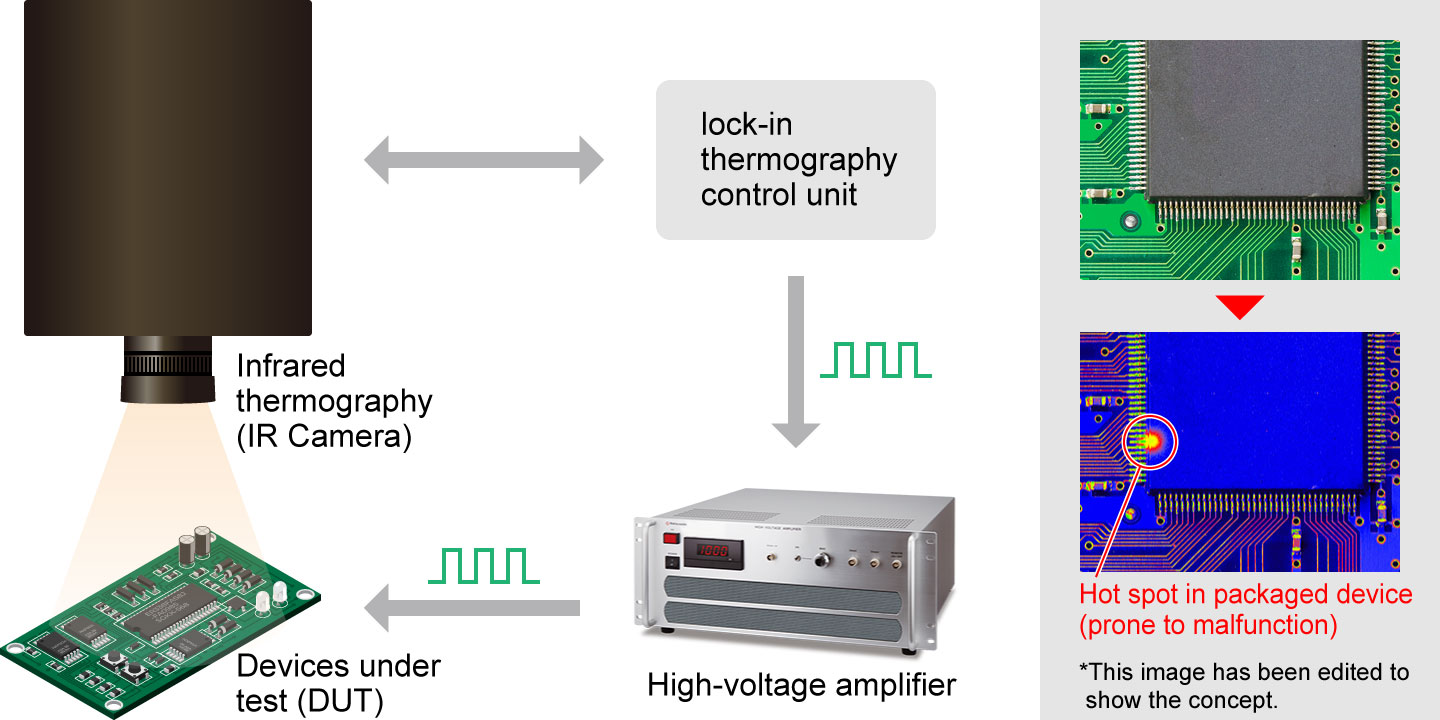
Lock-in Thermography (LiT) is an advanced analytical technology that applies pulses of cyclic electrical energy to semiconductor device packages, printed circuit boards (PCBs), and other test targets to detect defects and abnormalities based on localized heat generation (hot spots). Detecting slight temperature changes, which is impossible with conventional infrared thermography, allows for faster localization of defects. Lock-in thermography synchronizes the image acquisition of a high-speed infrared camera with periodic electrical energy. The name "lock-in" comes from this synchronization mechanism. Sources of cyclic electrical energy include high-voltage amplifiers, bipolar power supplies, and pulsed power supplies. In addition to electrical energy, other excitation sources such as ultrasound, microwaves, flash lamps, lasers, or physical forces (e.g., bending) can be used to apply a thermal load to the object. This technology is helpful for product failure analysis and nondestructive testing, such as potential defect analysis, thermal design, and battery thermal analysis.
Principles of Lock-in Thermography
When periodic electrical energy is applied to the object under inspection, it generates thermal waves that propagate from the heat source. These waves are reflected or scattered at subsurface features with different thermal properties, such as delaminations and inclusions. The propagation and reflection of these thermal waves cause localized variations in the phase and amplitude of the surface temperature oscillations, which are then captured by the camera. This thermal reaction is periodically captured by an infrared camera, and temperature changes are extracted and analyzed using the lock-in method. The lock-in method significantly improves the signal-to-noise ratio, enabling the detection of very slight temperature changes. By analyzing the phase shift and amplitude of the thermal wave, lock-in thermography derives information about the internal structure of the inspected object, including defects such as cracks, delaminations, cavities, and other sub-surface anomalies. For example, the depth of a defect can be estimated from the phase shift of the thermal wave, as deeper defects cause a greater phase lag. Furthermore, adjusting the lock-in frequency allows for controlling the analysis depth.
Lock-in thermography is used in a variety of industries, including electronics, aerospace, automotive, and materials science.
- Electronics: Semiconductor devices, Short-circuits in electronic components, Printed circuit boards (PCBs), Current leakage, ESD defects, Gate oxide damage, Defect detection in transistors and other components, Solar cells, Dielectric breakdown, Whiskers
- Aerospace: Turbine blades, internal defect inspection of critical components such as composite structures
- Automotive: Failure evaluation of components such as batteries, motors, and electronic control units, battery thermal management for electric vehicles
- Thermal design and analysis: product defect analysis, thermal design and thermal analysis of components such as batteries and printed circuit boards (PCBs)
- Related Terms:
-
- Lock-in Thermography (LiT)
- high-voltage amplifier
- infrared thermography
- Hot spot
- internal defect inspection
- Short-circuit
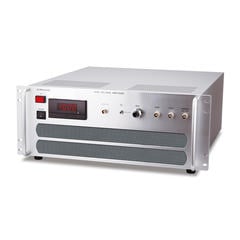
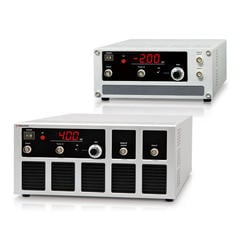
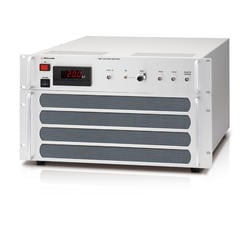
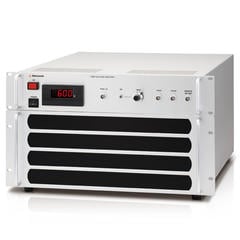
Recommended products
Matsusada Precision produces high-speed and high-voltage amplifiers for lock-in thermography.